Comments
The same basic tendencies noted in Russia as a whole were also witnessed in Saint
Petersburg between 1990 and 1998: collapse of macro-indicators between 1991 and 1993,
slowed rate of collapse between 1994 and 1996, relative stabilization of the situation in
1997. During the latter half of 1997 and from January through August 1998, the gross
regional product (GRP) of Saint Petersburg was on the rise. However, this improvement was
cut short by the Russian financial and economic crisis that started on August 17, 1998.
During the reform years the GDP of Russia fell 42% while in Saint Petersburg, according to
estimates of the Committee on Economics and Industrial Policy, the GRP fell no less than
45%.
When reforms first began, production and distribution were planned and handled by the
Gosplan and Gossnab centralized systems, and the concept of «solvent demand» did not
exist. As a general rule, there was a production deficit, i.e. solvent demand exceeded
supply. So the drop in industrial production in the city was more apparent than that in
Russia as a whole, where the decline of processing industries was made up for somewhat by
extraction industries.
The share of the GRP of Saint Petersburg in the sum total of gross regional products in
Russia made up 3.2% in 1994 and 3.3% in 1997.
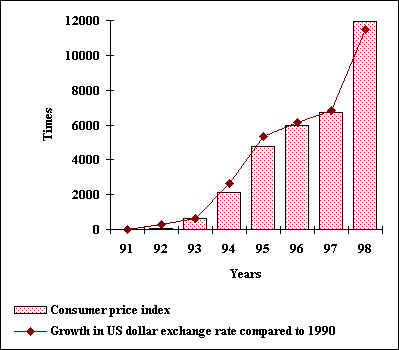
Between 1995 and 1997 the rate of inflation in Russia and the regions was slowed
considerably as compared to the rate in 1991-1994. The average monthly growth of prices on
goods and services in Saint Petersburg during the reform years was higher than that of
Russia as a whole, but lower than in Moscow. Between 1996 and 1997 relative parity was
achieved in the dynamics of price changes on various markets, including the consumer
market, industrial equipment, and investment; this parity was expressed in their
coordinated movement.
The inflation rate was halted, on the one hand, by the absence of financial resources
and, as a result, a drop in solvent demand and production by domestic manufacturers and,
on the other, as a result of the saturation of the domestic market with imported goods and
the prices established for these goods insuring high profits for importers. The low
solvent demand of industrial enterprises, increasing inability to pay bills and increasing
practice of non-monetary forms of payment have all told on price dynamics in recent years.
The reform years saw a sharp drop in the ruble rate with respect to the US dollar. The
currency rate was relatively stable between 1996 and the first half of 1998, especially
when the currency corridor was in place. However, the Russian’s government’s
announcement on August 17, 1998, that it would not pay on its domestic and foreign loan
obligations, a run of investors and banks on the hard currency market and the collapse of
financial pyramids and a number of banks that were not controlled by the government led to
a crash of the ruble exchange rate.
Nevertheless, Saint Petersburg remains the largest producer of industrial and consumer
goods among the regions of the north west, both according to absolute indicators and in
per capita terms. In 1998 the volume of consumer goods production in the city amounted to
13.0 billion rubles, or 2,700 per capita (in the Novgorod Region 2,500 rubles, in the
Pskov Region 1,400 rubles, in the Leningrad Region 900 rubles). Production volumes in
Saint Petersburg for dairy products, bread and baked goods greatly exceed similar
indicators for neighboring regions.
Investments in fixed assets were bolstered by increased input of funds from enterprises
and companies, the figure for which reached 53% this year (as opposed to 47% in 1997). At
the same time, the share of funds provided by the federal budget decreased four times in
1998, from 16% to 4%.
Compared to other regions of the north west, in 1998 Saint Petersburg had the best
indicators for volume of contract work and paid services provided to the population. This
figure reached 107% in 1997. The unemployment rate among economically active members of
the population remained low at 1.6% by the end of 1998.
Despite the continuing financial crisis in the country, the Saint Petersburg budget
continues to be carried out successfully. Thus, according to preliminary data of the
Finance Committee, budget performance in 1998 amounted to 84.9% of revenues and 82.8% for
expenses. We can proudly state that even under crisis conditions Saint Petersburg
continues to be one of the most reliable regions.
According to information from the Saint Petersburg administration Committee on
Economics and Industrial Policy (CEIP), the average yearly labor resource figure for 1998
was estimated at 3,045,000 persons. We should also note the tendency for the labor
resource figure to rise during the forecast period (to year 2001).
At the same time, the number of people employed in the economy is decreasing and in
1998 amounted to 2,332,000 persons (according to estimates). By 2001 this number will fall
to 2,326,000 (99.2%) of 1997 levels, and the average yearly rate of decrease amounted to
0.03% or 2,000 people in average yearly human terms.
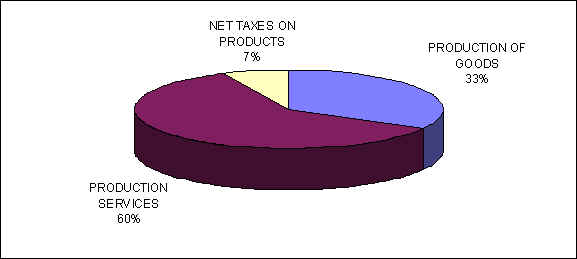
The structure of employment can be quantitatively expressed in the dynamics of
employment according to branch and sector of the economy.
We can see that during the forecast period the level of employment has been decreasing
slightly in material production.
Employment figures for branches of the economy (in %)